Profound concerns over U.S. drinking water quality, water shortages and energy inefficiencies motivated the International Association of Plumbing & Mechanical Officials (IAPMO) to lead a research project along with the American Society of Plumbing Engineers (ASPE), the Water Quality Research Foundation (WQ-RF), and the University of Cincinnati, to develop a new statistically based pipe-sizing method. This multi-year effort resulted in the development of the Water Demand Calculator (WDC) – hailed as the most important innovation in pipe sizing in almost a century.1
Along with addressing the primary concerns of water safety and energy efficiency (see “IAPMO’s Water Demand Calculator for Right-Size Plumbing” and “Efficient Hot-Water Piping”), applying the WDC also provides significant cost reductions resulting from the use of smaller water pipes, fittings, and related components, and from lower utility connection and water-use fees. This article discusses the potential economic benefits of applying the WDC over traditional pipe sizing methods in the construction of residential buildings2.
Two studies were conducted as part of this project:
- IAPMO commissioned Stantec Architecture to calculate the material and labor costs saving potential of applying the WDC as compared to applying the sizing methods contained in baseline plumbing codes, specifically, IAPMO’s Uniform Plumbing Code, the International Code Council’s (ICC) International Residential Code (IRC) and the ICC’s International Plumbing Code (IPC).
- IAPMO also commissioned the Alliance for Water Efficiency (AWE) to conduct a study investigating the cost savings resulting from reduced meter connection fees and utility water use fees, which are based on water meter size. Both studies are available for download at https://www.iapmo.org/media/25249/water_demand_calculator_study-final.pdf and https://www.iapmo.org/media/25939/awe-meter-size-connection-fee-research.pdf .
The results from the two studies show significant cost savings potential associated with applying the WDC. For example, the total average savings for a typical 2,379 square foot single family home in a high cost labor market can exceed $2,000.00 and can be as high as $5,000.00, depending on location. For multi-family apartment buildings, the potential savings are even higher and can exceed $100,000.00 on a 45-unit multi-family building, especially where utility meter connection fees are high due to water scarcity.
Background
IAPMO’s Water Demand Calculator (WDC) represents the first significant update for water pipe sizing in buildings since the development of Hunter’s Curve more than 80 years ago. Of course, much has changed in the way Americans use water since 1940, when Dr. Roy Hunter developed his namesake method for determining water demand in a building. In fact, plumbing fixtures and appliances use only of fraction of the water they consumed since the mid-1980s. See Table 1 below.
Table 1: Water consumption by water-using plumbing products and appliances – 1980s to 20213
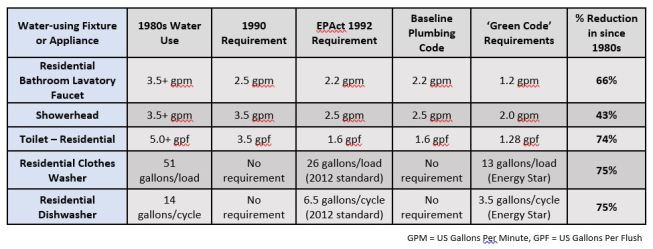
As a result, the plumbing systems in our single- and multi-family homes and buildings are oversized, which results in:
- increased water aging and declining water quality resulting in an increased risk from biofilm development, Legionella and other opportunistic pathogens wasted energy and water;
- unacceptably long hot water delivery times;
- unnecessary material and labor costs during construction; and
- unnecessarily high water meter connection fees and utility water use fees
The Stantec Architecture Study
As mentioned above, Stantec Architecture calculated the material and labor costs saving potential of applying the WDC as compared to applying the sizing methods contained in the Uniform Plumbing Code, the International Residential Code (IRC) and the International Plumbing Code (IPC). To ensure a fair comparison of material and labor costs, the Stantec study investigated and applied the most the economic design options offered in the entirety of the UPC, IRC, and IPC including each code’s appendices.
Three building prototypes were developed for comparison: an average size, 2,379-square-foot single family home, a 6-unit multi-family residence, and a 45-unit multi-family residential unit. The prototypes were specifically developed to represent typical homes and multi-family residences that are currently being constructed.
Construction and labor costs vary regionally in the United States, so three metro areas that represent high costs (New York City), mid-range costs (Pittsburgh) and low costs (Oklahoma City) were selected for the study. Material costs were calculated using trunk and branch copper systems and PEX manifold systems.
Stantech Architecture Results
Table 2 (below) shows the total material and labor cost savings of applying the WDC based on a U.S. dollar / percentage basis as compared to applying the UPC, IPC, or IRC. These values represent the cost savings that can be expected when applying the Water Demand Calculator on one single-family home or multi-family building.
Table 2: WDC Cost Savings (US Dollars / Percent)
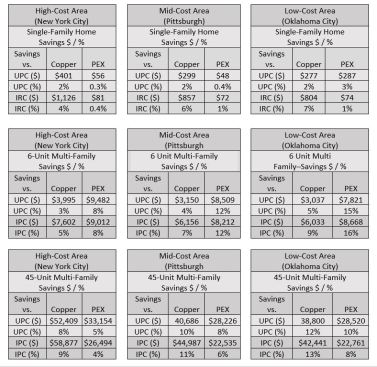
The Stantec report found that:
- Due to reduced GPM requirements, the application of IAPMO’s Water Demand Calculator resulted in notable construction cost savings associated with each of the three residential prototypes. The primary cost savings are associated with reduced diameter water service entrances, interior cold water mains / branches, interior hot water mains / branches, fittings, labor, and appurtenances.
- Utilizing the Water Demand Calculator for sizing of residential cold and hot water mains, branches and risers will result in:
-Shorter water dwell times in residential plumbing systems will improve water qualityand thus, most importantly, improve public health and safety.
-Reduced water service entrance, interior cold water mains / branches, interior hot water mains / branches, fittings, labor, and appurtenances.
– Faster hot water delivery times throughout the hot water systems, will also save energy, water, and reduce utility bills for the entire life of the plumbing system.
The Alliance for Water Efficiency Study
Utility water meter connection fees for new buildings and reoccurring water and sewer service fee charges are determined by the size of the building’s water meter, which in turn, are based on the building’s calculated water demand. Because the WDC takes modern water usage patterns into account, the calculated water demand is reduced, allowing for the installation of smaller water meters and plumbing system piping.
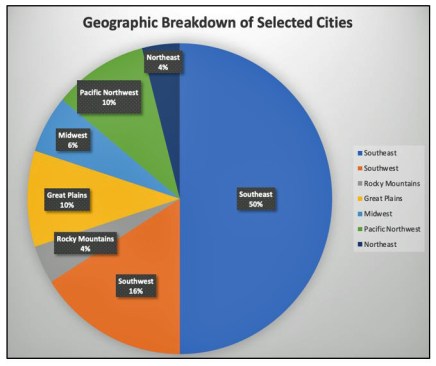
Figure 1

AWE collected data related to water connection fees and reoccurring water and sewer service charges by meter size for 50 of the fastest growing metro areas in the United States. Figures 1 (left) and 2 (below) show the geographic location and regional breakdown of the cities selected for the study. The purpose was to build a dataset that would provide information about the difference in connection fees and reoccurring charges by water meter size, and the potential cost savings that are available due to the emergence of an updated pipe sizing methodology, the Water Demand Calculator.
Figure 2
Data was collected on common meter size connection fees ranging from 5/8” to 12” and also to document water use and sewer fees by meter size for each city. Additional data was recorded for each city including water billing frequency (e.g., monthly, bi-monthly, or quarterly) and volumetric water rates. It should be noted that water supply flows required for fire suppression are not considered in the AWE report.
AWE Results
As shown in Table 3 (below), the research found extensive variability of connection fees across the country. The cost of a connection fee at a certain meter size can differ by mere tens of dollars up to hundreds of thousands of dollars. For example, the connection fee for a 4-inch meter in Spokane, WA is $9,857 while in nearby Portland, OR the connection fee for the same meter size is $85,311.4
Table 3 – Summary Statics of Connection Fee by Meter Size
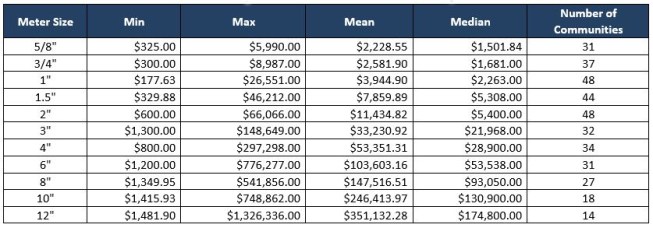
Both the Mean (average) and Median values are shown in Table 3. While the Mean value includes outliers due to the wide variability of connection fees, the Median value better reflects the typical cost savings that can be expected when utilizing the WDC. Special attention should be placed on the ¾” to 2” meter size connection values, as these will typically apply to single-family homes.
For example, in the Stantec study, the meter size and building supply in the prototype single family home is one inch when consulting currently utilized fixture unit value pipe sizing methods. However, when the WDC is applied, it allows for the building supply and water meter to be reduced to ¾-inch. In San Francisco, CA, the city with the highest connection fees according to the AWE study, one pipe-size reduction would reduce water and sewer connection fees from over $26,000 to $9,000, an incredible savings of over $17,000. More typical savings from reducing meter sizes can be determined from the Median column.
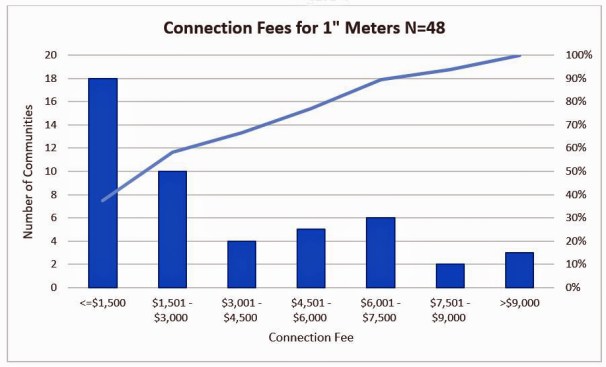
The histogram in Figure 3 (belowP shows the distribution of connection fees for 1-inch meters only. The data shows that over 60 percent of 1-inch meter connection fees exceed $1,500 and over 40 percent exceed $3,000. Thus, the majority of single-family homes will realize significant connection fees cost reductions in addition to the material and labor savings detailed in the Stantec report shown on page 3.
Figure 3
The Savings Potential of the WDC
Combining the cost savings from the Stantec Report and the median value connection fee savings from AWE Report provides a conservative estimate of the cost savings potential resulting from simply applying the Water Demand Calculator as opposed to applying the outdated fixture unit based pipe sizing methods. The examples shown in Table 4A and Table 4B show the combined savings as opposed to applying the pipe savings methods found in the 2018 Uniform Plumbing Code or the International Plumbing Code (IPC).
Table 4A – Combined Construction Cost Savings, Annual Water Usage and Sewer Fee Savings (Water Demand Calculator vs. IPC / IRC)
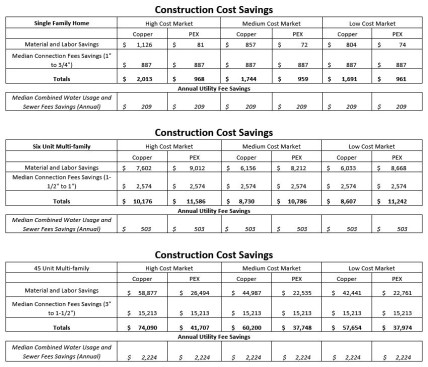
Table 4B – Combined Construction Cost Savings and Annual Water Usage Savings (Water Demand Calculator vs. UPC)
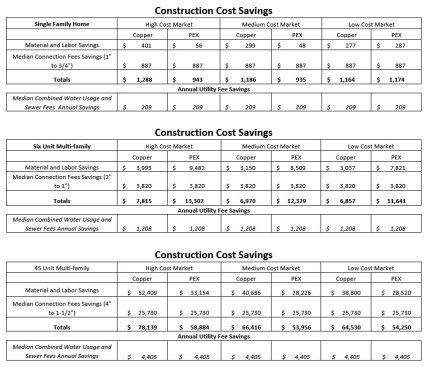
Note that since the median connection fee values from the AWE report were applied in Table 4A and 4B, the saving from applying the WDC will be considerably higher in many areas, especially in areas where water scarcity has curtailed development.
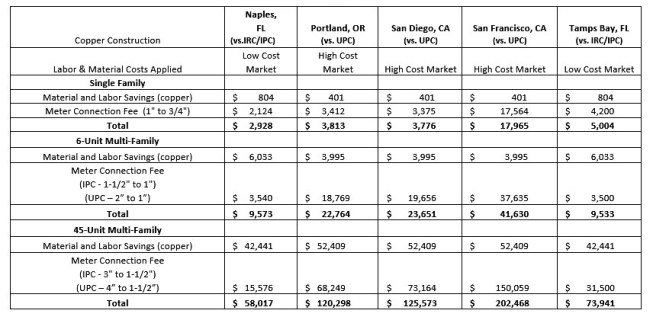
Table 5 (below) details the saving resulting from applying the WDC when constructing the model buildings in nine select fast growing metro areas.
Table 5 – Example Total Savings in Select Fast Growing Metro Areas
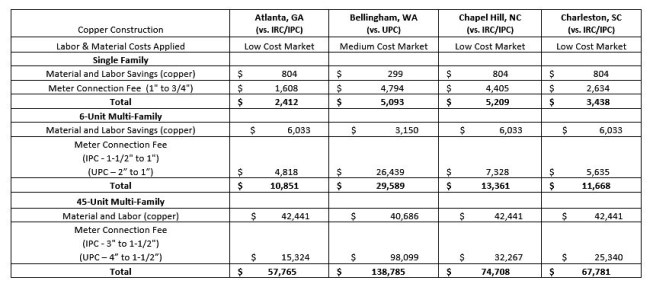
Table 5 Continued – Example Total Savings
Summary
The Water Demand Calculator is a powerful and much needed tool needed to bring pipe-sizing methodology into the 21st century. The primary benefits of applying the WDC pertain to addressing water quality concerns associated with water aging in oversized plumbing systems and in providing for water and energy efficiency. However, the WDC also provides for significant construction cost efficiencies and works to increase homeowner satisfaction when using modern, efficient plumbing products, making applying the WDC attractive to builders as well.
1. Visit https://www.iapmo.org/water-demand-calculator/ to learn the technical details about how the WDC works and how to download it.
2. The WDC is currently only applicable for residential buildings. However, currently planned research pertaining to water use patterns in non-residential building will allow for the future use of the WDC in non-residential buildings.
3. The Drainline Transport of Solid Waste in Buildings, PERC 1 Report – Chart by J. Koeller, P. DeMarco (updated)
4. Visit https://www.iapmo.org/media/25924/connectionfeematrix.pdf to view the full data set of connection fees from the cities selected for the study.